Statistics is the science of learning from Data.
Data is essentially numbers (or text/symbols) which represent some information.
It helps to think of data as 'value' of quantitative and qualitative variables
What are the variable types :
Numerical or Quantitative: (Continuous and Discrete)
Categorical or Qualitative: (Always discrete)
- Normal
- Ordinal
Descriptive Statistics
Quantitatively describing the data
- Graphical representation
- Tabular representation
- Summary statistics
Descriptive versus Inferential. The use of sample and Population
Single and Multiple variable
Distributions and Relationships
Graphical Representation : Single Variable
For Categorical Variables :-

For Quantitative Variables :-

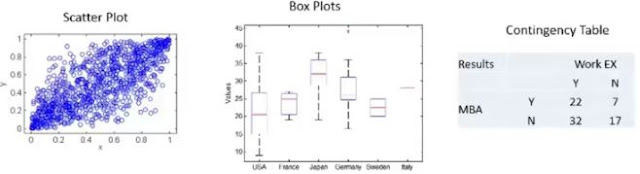
Graphical Representation : Multiple Variables
Scatter Plots: Two quantitative variables
Box plots - One categorical with one quantitative variable
Contingency tables - categorical variables with frequency of occurrence as the theme.
Data is essentially numbers (or text/symbols) which represent some information.
It helps to think of data as 'value' of quantitative and qualitative variables
What are the variable types :
Numerical or Quantitative: (Continuous and Discrete)
Categorical or Qualitative: (Always discrete)
- Normal
- Ordinal
Descriptive Statistics
Quantitatively describing the data
- Graphical representation
- Tabular representation
- Summary statistics
Descriptive versus Inferential. The use of sample and Population
Single and Multiple variable
Distributions and Relationships
Graphical Representation : Single Variable
For Categorical Variables :-

For Quantitative Variables :-

Graphical Representation : Multiple Variables
Scatter Plots: Two quantitative variables
Box plots - One categorical with one quantitative variable
Contingency tables - categorical variables with frequency of occurrence as the theme.


.jpg)


No comments:
Post a Comment